
The ability to quickly and accurately analyze data is crucial in the stock market. When it comes to intraday dealing in India, the intraday stock screener stands out as a key tool for traders. A powerful intraday stock screener lets traders quickly pick through the many stocks that are traded on the Indian markets. This helps them find the ones that fit with their intraday strategies.
We’ll talk about what makes a good intraday stock screener, such as real-time data changes, filters that can be changed, charting tools, and how easy it is to use. By knowing what these top screeners have to offer, traders can improve their intraday trading, make picking stocks easier, and possibly improve their overall trading results. In this blog, we’ll talk about the different kinds of intraday stock screeners. This will give you the information you need to make smart choices and use the best intraday stock screener for your trading.
What are intraday stock screens?
Intraday stock screeners are useful tools that traders use to filter and find possible trading opportunities within a single trading day. These screeners are pieces of software or online platforms that let traders choose stocks based on certain factors and parameters. By doing this, they can quickly narrow down the huge number of stocks to a smaller, more manageable list that fits with their trading strategies and opinions.
Concept
Intraday stock screeners work by filtering stocks based on factors that have already been set. Traders can put in different parameters, such as price, volume, market capitalization, volatility, technical indicators (like moving averages or RSI), and economic metrics (like earnings per share or the price-to-earnings ratio). The screener then looks through the market in real time to find stocks that meet the conditions you set.
For example, a trader could use a screener to find companies with a current price above 50, a volume of at least 500,000 shares, a relative strength index (RSI) value below 30 (which could mean that the stock is oversold), and a positive earnings surprise. The screener will show a list of stocks that meet these criteria, giving traders a focused set of choices to think about for intraday trading.
How do stock screeners help traders?
Efficiency: Day trading moves quickly, so traders have to make choices quickly. Stock screeners help buyers save time by automating the process of sorting through thousands of stocks to find ones that meet certain criteria. This lets traders focus on a list of possible deals that they can handle.
Customization: Each trader has his or her own strategies and interests. Intraday stock screeners let traders set their own criteria based on technical and fundamental factors that fit with how they trade. This helps buyers find stocks that fit with the way they trade.
Objective choices: When you use a stock screener, you can be sure that your trading choices are based on pre-set, objective criteria, not on your feelings or a gut feeling. This can lead to better trade decisions and more accuracy.
Identifying Opportunities: Stock screeners help buyers find good deals that they might not have seen otherwise. Screeners help traders find stocks that meet their needs by looking at a wide range of stocks and showing the ones that meet certain criteria.
Reducing Noise: The stock market is full of noise and information overload. Stock screeners cut through this noise and present traders with a focused list of potential trades that match their specific parameters.
Real-time Insights: Intraday stock screeners operate in real-time, providing traders with up-to-the-moment data. This is crucial for intraday trading, where market conditions can change rapidly.
In conclusion, intraday stock screeners are invaluable tools for traders who engage in intraday trading. They streamline the process of identifying potential trades, increase efficiency, and assist traders in making objective decisions based on predefined criteria. By narrowing down the universe of stocks to those that fit specific conditions, traders can focus their efforts on executing successful intraday trading strategies.
The best intraday stock screeners in India
Nseindia
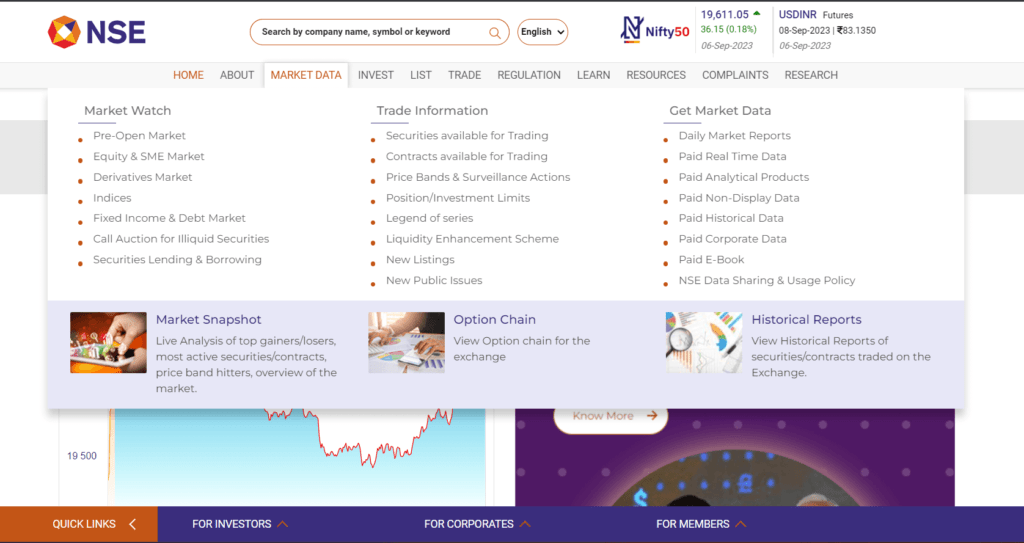
NSEIndia.com can be a useful tool for intraday traders as it provides a variety of features to help screen and analyze stocks for potential intraday trading opportunities. Here are some of its features, along with their pros and cons:
Features:
Live Market Data: NSEIndia.com offers real-time market data, including stock prices, indices, and market depth, which is crucial for intraday traders to make timely decisions.
Stock Screener: The website provides a stock screener that allows traders to filter stocks based on various criteria such as price, volume, sector, and technical indicators. This helps traders identify potential candidates for intraday trades.
Technical Charts: NSEIndia.com offers interactive and customizable technical charts that display price movements, patterns, and various technical indicators. Traders can analyze stock trends and patterns to make informed intraday decisions.
Top Gainers and Losers: The website displays a list of the top gainers and losers of the day. This feature can help traders quickly identify stocks with significant price movements.
Sectoral Indices: NSEIndia.com provides information on sectoral indices’ performance, allowing traders to focus on specific industry sectors that are performing well during the day.
Market News: The platform offers market news and updates that can impact stock prices. Staying informed about news events can help traders anticipate price movements.
Market Heatmap: The heatmap provides a visual representation of how stocks are performing. It helps traders quickly identify which stocks are experiencing positive or negative price changes.
Pros:
Real-time Information: NSEIndia.com provides up-to-the-minute data, which is essential for intraday trading where timing is critical.
Customizable Charts: Traders can customize technical charts with indicators and overlays, tailoring their analysis to their trading strategy.
Sector Performance: Information on sectoral indices helps traders focus on areas of the market that are currently trending.
News Integration: Market news keeps traders aware of events that could impact stock prices during the trading session.
User-Friendly Interface: The website’s interface is designed to be easy to navigate, making it accessible to traders of different skill levels.
Cons:
Information Overload: The abundance of data can overwhelm new traders, making it challenging to focus on relevant information.
Delayed Data: While NSEIndia.com provides real-time data, there might still be slight delays in data transmission, which could affect split-second decisions.
Technical Analysis Skill Required: Effective use of technical charts and indicators requires a good understanding of technical analysis concepts.
Limited Fundamental Data: The platform primarily focuses on technical and market data, lacking in-depth fundamental analysis tools.
Reliance on Internet Connectivity: Traders need a stable internet connection to access real-time data consistently.
In conclusion, NSEIndia.com offers valuable features for intraday traders, including real-time data, technical analysis tools, and market news. However, traders should be aware of the potential drawbacks, such as information overload and the need for technical analysis skills. It’s advisable to use the platform in conjunction with other reliable sources and tools to make well-informed intraday trading decisions.
Trading view
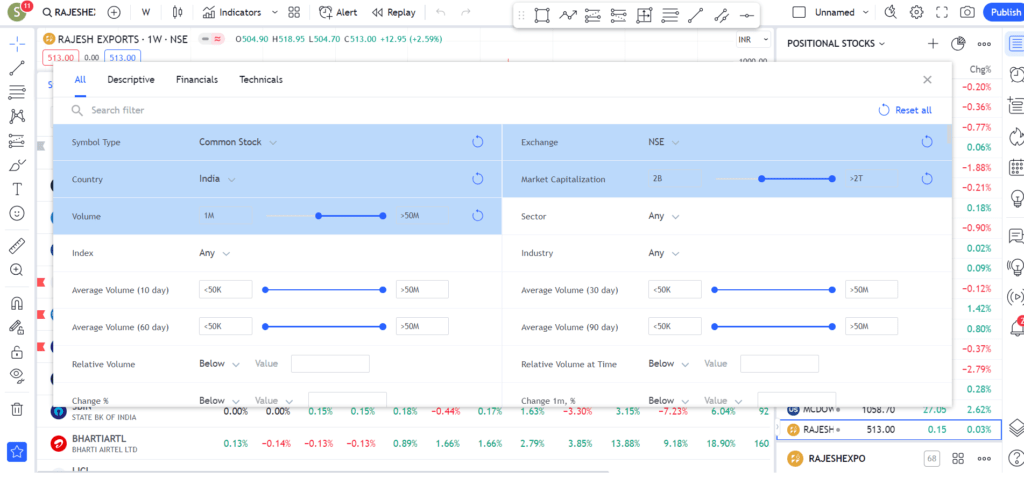
Trading View is a well-known online charting and technical analysis platform that intraday traders frequently use to find potential trading opportunities. It offers a range of features that make it a versatile tool for traders looking to screen stocks for intraday trading.
Features:
Advanced Charts: TradingView provides interactive and customizable charts with a wide range of technical indicators, drawing tools, and chart types. Traders can analyze price patterns, trends, and key levels.
Stock Screener: The platform offers a powerful stock screener that allows traders to filter stocks based on criteria like price, volume, technical indicators, fundamental ratios, and more.
Customizable Alerts: Traders can set up custom alerts based on price levels, technical conditions, or indicator crossovers. This ensures they are notified when potential trade setups occur.
Social Community: TradingView has a social aspect where traders can share ideas, analyses, and strategies. This can be a valuable source of insight for intraday traders.
Real-time Data: The platform provides real-time data from various markets, which is crucial for making informed intraday decisions.
Paper Trading: Traders can practice their strategies using the paper trading feature, which allows them to simulate trades without risking real capital.
Pros:
Advanced Technical Analysis: TradingView offers an extensive array of technical analysis tools and indicators, catering to both novice and experienced traders.
Customizability: Traders can customize charts and indicators according to their preferred trading strategies.
Community Engagement: The ability to interact with a community of traders can provide valuable insights and learning opportunities.
Cross-Device Access: TradingView is accessible via web browsers and mobile apps, allowing traders to stay connected and make decisions on the go.
Comprehensive Data: Real-time data from various markets and asset classes enables traders to explore multiple opportunities.
Cons:
Learning Curve: Mastering the advanced features and technical analysis tools might require time and effort, especially for beginners.
Subscription Tiers: While a basic version is available, some advanced features may require a subscription, which can be a cost consideration.
Internet Dependency: Like any online platform, TradingView relies on a stable internet connection for real-time data and functionality.
Overwhelming Interface: The platform’s feature-rich interface can be overwhelming for new users, and it might take time to navigate and utilize effectively.
Limited Fundamental Analysis: While TradingView offers some fundamental data, its primary strength lies in technical analysis.
In conclusion, TradingView is a comprehensive platform for intraday traders due to its advanced charts, stock screener, and community engagement. However, its richness in features may initially be overwhelming for beginners, and subscription costs should be considered. Traders with a focus on technical analysis and an interest in community interaction can greatly benefit from TradingView’s offerings.
chartink
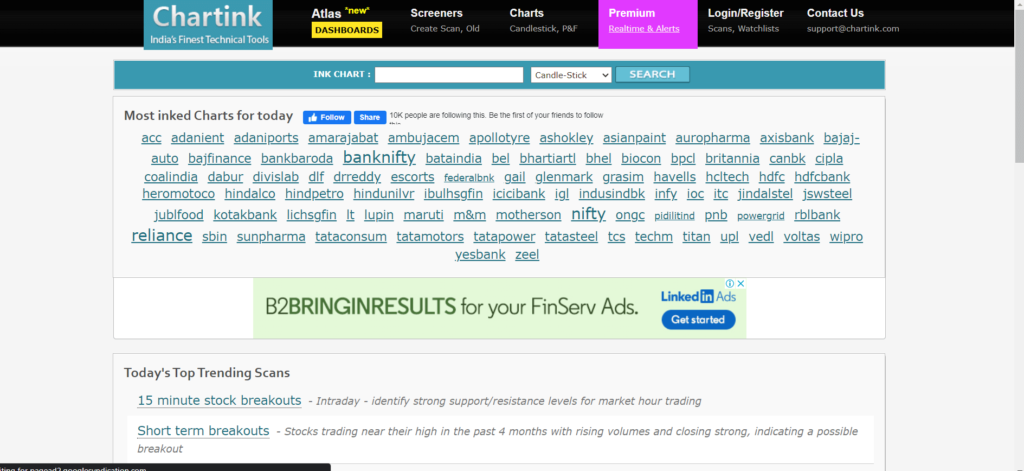
Chartink.com is a popular Indian stock market website that provides a range of tools for technical analysis and stock screening. In India, traders and investors frequently use it to examine stocks, find trading opportunities, and conduct technical analysis.
Features:
Technical Charts: Chartink.com offers interactive and customizable technical charts with various indicators, overlays, and drawing tools. Traders can analyze price patterns, trends, and momentum indicators.
Screener: The platform provides a powerful stock screener that allows users to filter stocks based on technical indicators, price range, volume, and more. Users can create custom screens to identify potential trading candidates.
Alerts: Traders can set up custom alerts based on technical conditions, allowing them to receive notifications when specific criteria are met.
Top Gainers and Losers: Chartink.com displays a list of the top gainers and losers of the day, helping traders quickly identify stocks with significant price movements.
Volume Shockers: The platform highlights stocks with unusual volume spikes, which can indicate potential price movements.
Scanner: Chartink.com offers pre-built scanners that automatically identify stocks meeting certain technical conditions, saving traders time on manual screening.
Pros:
User-Friendly Interface: Chartink.com’s interface is relatively straightforward, making it accessible to traders with varying levels of experience.
Customizable Charts: Traders can customize charts with a variety of technical indicators and tools to match their preferred trading strategies.
Wide Range of Technical Indicators: The platform provides a diverse set of technical indicators, allowing traders to perform in-depth technical analysis.
Focused on Indian Markets: Chartink.com is specifically tailored for the Indian stock market, providing relevant data and tools for Indian traders.
Alerts and Notifications: Custom alerts and notifications help traders stay informed about potential trading opportunities without constant monitoring.
Cons:
Limited Fundamental Analysis: The platform is primarily focused on technical analysis tools and may lack in-depth fundamental data.
Limited Learning Resources: While Chartink.com provides tools, it might not offer extensive educational resources for beginners to learn about technical analysis.
Delayed Data: Free users might experience delayed data updates, which could impact the accuracy of their analysis and trading decisions.
Dependence on Internet Connectivity: Like any online platform, Chartink.com requires a stable internet connection for real-time functionality.
Slightly Outdated Design: The website’s design might appear slightly outdated compared to some modern platforms.
In conclusion, Chartink.com offers a range of technical analysis tools and a powerful stock screener tailored for the Indian stock market. While it may lack comprehensive educational resources and certain fundamental analysis features, its focus on technical analysis and ease of use make it a valuable tool for Indian traders looking to identify potential trading opportunities.
Intradayscreener.com
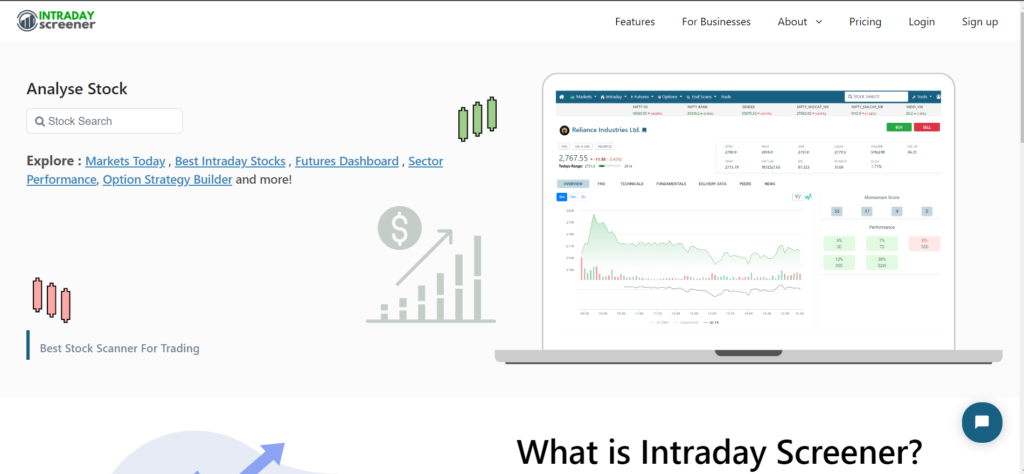
IntradayScreener.com is a dedicated platform designed to help traders screen and analyze stocks specifically for intraday trading purposes. It provides a range of tools and features that enable traders to identify potential intraday trading opportunities based on various technical criteria.
Features:
Real-time Screening: IntradayScreener.com offers real-time data and screening capabilities, allowing traders to find stocks that match specific intraday trading criteria.
Technical Indicators: The platform provides a variety of technical indicators that traders can use to create custom screens based on price, volume, momentum, and other technical factors.
Customizable Strategies: Traders can define their own custom trading strategies and conditions, tailoring their screens to match their preferred intraday trading setups.
Top Gainers and Losers: The platform displays lists of top gainers and losers, helping traders quickly identify stocks that are experiencing significant price movements.
Volume and Price Alerts: IntradayScreener.com allows traders to set up alerts for specific price or volume conditions, notifying them when potential trading opportunities arise.
Heatmap: The heatmap feature provides a visual representation of how stocks are performing, making it easy for traders to spot trends and potential trading candidates.
Pros:
Focused on Intraday Trading: IntradayScreener.com is specifically designed for intraday traders, providing tools and features that cater to their unique trading style.
Real-time Data: Real-time data updates ensure that traders have access to the most current information, which is crucial for making timely intraday decisions.
Customizable Screens: Traders can create and save custom screens based on their unique trading strategies, making the platform adaptable to various trading approaches.
Alerts and Notifications: The ability to set up alerts ensures that traders don’t miss out on potential trading opportunities.
User-Friendly Interface: The platform’s interface is designed to be intuitive and user-friendly, making it accessible to traders of different experience levels.
Cons:
Technical Analysis Skill Required: To effectively use the platform’s features, traders should have a good understanding of technical analysis and trading strategies.
Limited Fundamental Analysis: IntradayScreener.com primarily focuses on technical indicators and may not offer extensive fundamental analysis tools.
Subscription Costs: Some advanced features and real-time data might be available through premium subscriptions, which could be a consideration for traders on a budget.
Dependence on Internet Connectivity: The platform requires a stable internet connection to access real-time data and functionality.
In conclusion, IntradayScreener.com is a specialized platform that caters to intraday traders by offering real-time screening, technical indicators, and customizable strategies. While it requires a certain level of technical analysis expertise, its focus on intraday trading and user-friendly interface make it a valuable tool for traders seeking to identify potential intraday trading opportunities.
Trendlyne.com

Trendlyne.com is a comprehensive platform that provides tools and data for stock market investors and traders, including features for fundamental analysis, technical analysis, and stock screening. It offers a range of functionalities to assist users in making informed investment decisions.
Features:
Fundamental Analysis: Trendlyne.com offers a suite of fundamental analysis tools, including financial ratios, income statements, balance sheets, and cash flow statements for stocks. This allows users to assess a company’s financial health and performance.
Technical Charts: The platform provides interactive technical charts with various indicators and overlays, enabling users to perform technical analysis and identify potential trading opportunities.
Screeners: Trendlyne.com offers stock screeners that allow users to filter stocks based on criteria such as fundamentals, technical indicators, and sectoral performance.
Portfolio Tracking: Users can create and track their investment portfolios, monitor portfolio performance, and receive insights on portfolio diversification and allocation.
Analyst Consensus: The platform aggregates analyst recommendations and earnings estimates, providing users with insights into market sentiment and expert opinions.
News and Insights: Trendlyne.com offers market news, insights, and analysis, helping users stay updated on events that could impact their investment decisions.
Pros:
Comprehensive Analysis: Trendlyne.com combines both fundamental and technical analysis tools, offering a holistic approach for investors and traders.
Customizable Charts: Interactive technical charts with various indicators enable users to perform detailed technical analysis tailored to their strategies.
Fundamental Data: Users can access detailed financial data and ratios, allowing for thorough fundamental analysis of stocks.
Analyst Consensus: The aggregation of analyst recommendations and earnings estimates provides users with additional insights to consider.
Portfolio Management: The portfolio tracking feature helps users monitor their investments and assess portfolio performance.
Cons:
Learning Curve: Users, particularly beginners, might need time to familiarize themselves with the various tools and features available on the platform.
Subscription Costs: Some of the advanced features and data might require a subscription, which could be a consideration for users looking for free resources.
Dependence on Data Quality: The accuracy and quality of the data provided by the platform are crucial for making informed decisions.
Internet Connectivity: As an online platform, Trendlyne.com requires a stable internet connection to access its features.
Overwhelming for Beginners: The abundance of features and data might be overwhelming for novice investors or traders.
In conclusion, Trendlyne.com offers a comprehensive suite of tools for both fundamental and technical analysis, making it suitable for investors and traders looking for in-depth insights into stocks and the market. Its combination of analysis tools, portfolio tracking, and news updates provides users with a well-rounded platform to support their investment decisions.
Traderscockpit.com
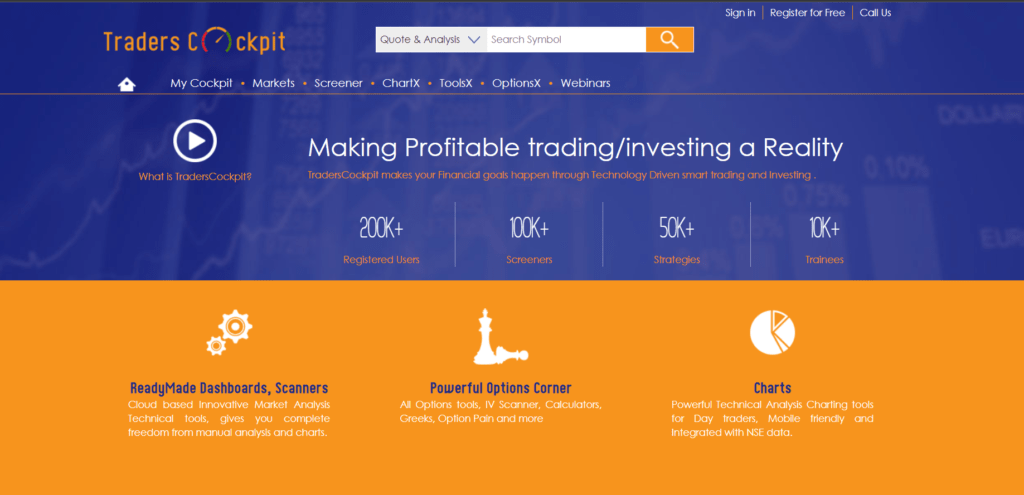
TradersCockpit.com is an online platform that offers a variety of tools and features designed to assist stock market traders and investors in their decision-making processes. It provides tools for technical analysis, options trading, and portfolio management.
Features:
Technical Analysis: TradersCockpit.com offers comprehensive technical analysis tools, including customizable charts, various technical indicators, and drawing tools for analyzing price trends and patterns.
Options Analysis: The platform provides tools for options traders, including option chain analysis, options strategy builders, and risk management calculators.
Screeners: TradersCockpit.com offers stock screeners that allow users to filter stocks based on technical indicators, fundamental data, and predefined strategies.
Portfolio Management: Users can create and track their investment portfolios, monitor portfolio performance, and receive insights on asset allocation and risk exposure.
Backtesting: The platform offers backtesting tools that allow users to test trading strategies using historical data to assess their potential effectiveness.
Educational Resources: TradersCockpit.com provides educational resources, webinars, and tutorials to help users improve their trading knowledge and skills.
Pros:
Comprehensive Analysis: The platform offers a wide range of analysis tools, catering to both technical and option traders.
Options Focus: Traders interested in options trading can benefit from the platform’s options analysis and strategy-building tools.
Customization: Customizable charts, technical indicators, and screeners allow users to tailor their analysis to their preferred trading strategies.
Portfolio Insights: Portfolio tracking and risk management tools provide valuable insights for managing investments effectively.
Backtesting: Backtesting features allow users to assess their trading strategies’ historical performance before implementing them.
Cons:
Learning Curve: Some users, especially those new to trading or options, might find the platform’s features and tools complex and require time to learn.
Subscription Costs: Depending on the features and data accessed, users might need to pay subscription fees, which could be a consideration for some.
Internet Dependency: The platform requires a stable internet connection for real-time data and functionality.
Market Dependence: The accuracy and reliability of the data provided by the platform are crucial for making informed decisions.
Overwhelming for Beginners: The abundance of features might be overwhelming for beginners who are still learning about trading.
In conclusion, TradersCockpit.com offers a comprehensive set of tools for technical analysis, options trading, and portfolio management. Traders and investors, particularly those interested in options, can benefit from its range of features. However, users should be prepared for a learning curve and consider subscription costs if they want to access premium features.
Stock Edge
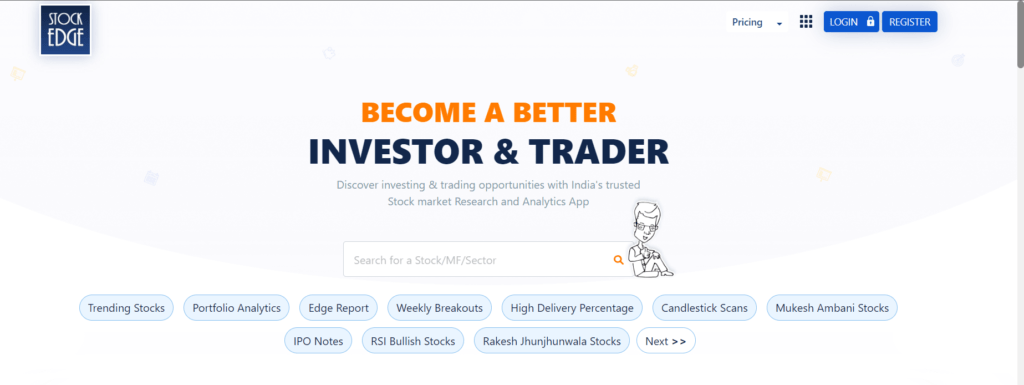
India’s traders and investors frequently use Stock Edge as a mobile application for stock market tracking, analysis, and research. It offers a range of features designed to help users make informed decisions in the Indian stock market. Here’s an overview of Stock Edge, including its features, pros, and cons:
Features:
Stock Analysis: Stock Edge provides detailed analysis of stocks listed on Indian stock exchanges. Users can access financials, peer comparisons, and other fundamental data.
Technical Analysis: The app offers technical charts with various indicators and overlays, allowing users to perform technical analysis on stocks.
Screener: Stock Edge has a stock screener that enables users to filter stocks based on technical and fundamental criteria. This helps users identify potential trading or investment opportunities.
F&O Analysis: It provides tools for analyzing options and futures, including open interest, implied volatility, and historical data.
Market News: Users can access market news, updates, and corporate actions to stay informed about events affecting the stock market.
Watchlists: Stock Edge allows users to create and manage watchlists to monitor their favorite stocks or sectors.
Portfolio Tracking: Users can track their investment portfolios, including stocks, mutual funds, and other assets. The app provides insights into portfolio performance and diversification.
Educational Content: Stock Edge offers educational content, including articles and tutorials, to help users improve their knowledge of stock market trading and investing.
Pros:
Indian Market Focus: Stock Edge is tailored for the Indian stock market, providing data and tools that are relevant for Indian traders and investors.
User-Friendly Interface: The app’s interface is designed to be intuitive and user-friendly, making it accessible to traders and investors with varying levels of experience.
Comprehensive Analysis: It combines both fundamental and technical analysis tools, catering to a wide range of users with different trading and investing strategies.
News Integration: Access to market news and corporate actions helps users stay updated about factors that can impact stock prices.
Portfolio Tracking: Portfolio management tools allow users to monitor their investments and assess their overall performance.
Cons:
Limited Global Coverage: Stock Edge primarily focuses on the Indian stock market, so it may not be suitable for users interested in international markets.
Subscription Costs: Some advanced features and data may require a subscription, which could be a consideration for users on a budget.
Internet Dependency: Like any mobile app, Stock Edge relies on a stable internet connection for real-time data and functionality.
Market Data Accuracy: The accuracy and reliability of the data provided by the app are essential for making informed decisions.
In conclusion, Stock Edge is a comprehensive mobile app designed for traders and investors in the Indian stock market. Its focus on both fundamental and technical analysis, along with features for portfolio tracking and news updates, makes it a valuable tool for those looking to navigate the Indian stock market. However, users should be aware of potential subscription costs and ensure they have a reliable internet connection for real-time data.
fatafatstockscreener
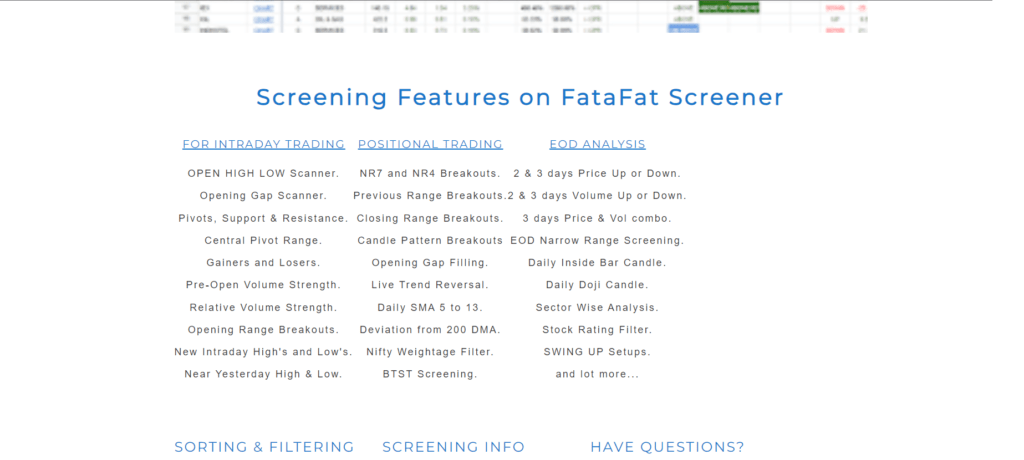
“FatafatStockScreener.in” is a stock screening tool or website that provides various features to help traders and investors identify potential trading opportunities in the stock market. The website offers a wide range of screening criteria and features that can be used to filter and analyze stocks for trading or investment purposes. The features and their functions are described below:
Features
Symbol: This identifies the stock by its trading symbol, which is a unique identifier for each publicly traded company.
Chart Links: This feature provides one-click links to open live Google Finance charts, allowing users to visualize price trends and patterns.
Sector: It categorizes each company by its operating sector, helping users narrow down their search to specific industries.
CMP, Open, High, Low: These columns display the current market price (CMP) along with the opening, high, and low prices for the trading day.
Change %: This shows the percentage change in the stock’s price from the previous day’s close.
Intraday %: It displays the percentage change in the stock’s price from the day’s opening.
Gap: This feature calculates and displays the opening gap percentage, whether it’s a gap-up or gap-down.
Gap Fill: It identifies stocks whose opening gaps are filled during intraday trading, whether they open with a gap up and then drop or open with a gap down and then rise.
Volume%: This measures the relative trading volume strength for the day as a percentage of the average traded volume over the past three days.
Pre-open Volume %: It compares the pre-opening session volume to the average of the past five days’ pre-opening volume, providing insights into early trading activity.
CPR (Central Pivot Range): This feature calculates and displays the central pivot range for the day, helping traders identify potential breakout points.
Pivots, S1, S2, R1, R2: These columns provide a visual screening of the current market price in relation to the day’s intraday pivot, support, and resistance levels.
New Highs and Lows: It identifies stocks that are making new intraday highs or lows, which can indicate strong price momentum.
Near Highs or Lows: This feature highlights stocks where the current market price is very close to the day’s high or low, suggesting potential breakouts or reversals.
DMA (Daily Moving Averages): It compares the short-term and long-term moving averages to determine the stock’s trend direction.
200 DMA: It calculates the percentage deviation of the stock’s price from the 200-day moving average, which is often used to gauge long-term trends.
Open = High or Low: This identifies stocks where the opening price is either equal to the day’s high or low, which can be used in certain trading strategies.
CMP to Yesterday’s H or L: This compares the current market price to yesterday’s trading range, which is useful for the Opening Range Breakout (ORB) strategy.
After 10:15 AM, it identifies stocks that exhibit opening range breakout signals based on the first hour’s trading.
After 2:45 PM: This feature highlights stocks making last-minute breakouts or creating new highs or lows in the late trading session.
NIFTY and BNIFTY Weightage: These options allow users to filter stocks by their weightage in the NIFTY and BANKNIFTY indices.
NR7 and NR4 check: EOD: This identifies stocks that match the Narrow Range 7 (NR7) and Narrow Range 4 (NR4) candlestick patterns on yesterday’s daily candles.
NR7 and NR4 break: It identifies stocks that are breaking out of NR7 and NR4 patterns during intraday trading.
Reversal: This identifies stocks where the current market price is reversing after three days of continuous upward or downward movement.
Candle Patterns: EOD: This feature identifies specific candlestick patterns, such as Inside Bar, Outside Bar, and Doji, on yesterday’s daily candles.
Top Bottom Patterns (EOD): It identifies stocks that have formed short-term top or bottom patterns on yesterday’s daily candles.
3 Day Closing (EOD): This feature identifies stocks with continuous closing in the green or red for the previous two or three days.
3 Day Volume (EOD): It identifies stocks with increasing traded volume over the previous two or three days.
3 Day Gaps (EOD): This feature identifies stocks that have been opening with gap-ups and closing higher, or vice versa, for the previous two or three days.
3 Day Price and Volume (EOD): It identifies stocks that have seen a continuous price increase or decrease over the previous three days, accompanied by increased volume.
Month % (EOD): This shows the percentage change in the stock’s price for the current month.
Bounce: EOD identifies stocks that bounce off the 20-day simple moving average (SMA), which can be of interest to swing and positional traders.
Intraday Stock Profiler: This profiles intraday strength based on breakouts above or below two days’ high and low prices.
Prev. Day High Rejection: It identifies when the current market price gets rejected at the previous day’s high, which can signal intraday reversals.
Prev. Day Low Bounce: This feature identifies when the current market price bounces up at the previous day’s low, another signal for intraday reversals.
15 minutes and 30 minutesORB: It identifies stocks breaking out of the first 15 and 30 minutes’ opening range.
1st hr Vol Strength: This measures today’s first-hour trading volume relative to the three previous days’ first-hour volume, helping identify active stocks in the opening session.
Volatility: EOD calculates and displays the volatility of each stock based on the previous five days’ trading.
Rsi: EOD: It provides the daily Relative Strength Index (RSI) value for each stock.
Atr-EOD: This shows the average true range (ATR) value based on five days of trading.
Intraday Trendline: It identifies stocks near intraday trendline support or resistance and those breaking these trendlines.
Engulfing (EOD): It identifies stocks that have formed bullish or bearish engulfing candlestick patterns on the previous day’s candles.
Gap & Reverse: EOD: This feature identifies stocks continuously opening with gap-ups and closing down, or vice versa, for the previous two and three days.
Yest Close Near (EOD): It identifies stocks closing near their highs or lows, which can help filter strong and weak stocks for the next day’s intraday trading watchlist.
Open Interest (EOD): EOD (End of Day) is a vital metric for traders and investors. It measures the previous day’s change in open interest as a percentage. This valuable reference is indispensable for intraday trading, offering insights into market sentiment and potential price movements. Tracking open interest helps traders identify positions taken by market participants and can be a key factor in making informed trading decisions. Whether you’re an experienced trader or just starting, understanding Open Interest – EOD can be a game-changer in your trading strategy.
Pros:
Comprehensive Screening: FatafatStockScreener.in offers a wide range of screening criteria, allowing users to filter stocks based on various technical and intraday parameters. This extensive screening capability helps traders and investors identify potential trading opportunities that match their strategies.
Intraday Insights: The platform provides intraday-specific features such as gap analysis, volume strength, pivot points, and opening range breakout signals. These tools are particularly useful for intraday traders looking to make quick decisions based on real-time data.
Technical Analysis Support: Traders who rely on technical analysis will find the platform’s features, such as moving averages, candlestick patterns, and trendline analysis, valuable for making informed trading decisions.
User-Friendly: The platform is designed to be user-friendly, making it accessible to traders and investors with varying levels of experience. The clear categorization of screening criteria makes it easy to use.
Visualization: FatafatStockScreener.in offers one-click links to open Google Finance charts, allowing users to visually analyze stock price trends and patterns alongside the screening results.
Customization: Users can tailor their screening criteria and create custom watchlists based on their trading or investment preferences, providing flexibility to match their strategies.
Cons:
Data Accuracy: The accuracy and reliability of the data provided by the platform are crucial for making informed trading decisions. Users should ensure that the data source is reliable and up-to-date.
Learning Curve: Some features and technical terms may be complex for beginners, and users may need time to understand and utilize the full potential of the platform effectively.
Overwhelming for Novices: The wide range of screening criteria and technical indicators could overwhelm novice traders who are still learning about stock market analysis and trading strategies.
Subscription Costs: Depending on the platform’s pricing model, advanced features or premium access may require a subscription, which could be a consideration for users on a budget.
Internet Dependency: Like most online platforms, FatafatStockScreener.in relies on a stable internet connection for real-time data updates and functionality. Users should ensure a reliable internet connection for seamless use.
Indian Market Focus: The platform seems to be primarily tailored for the Indian stock market. Users interested in international markets may not find the platform relevant for their trading needs.
No Historical Data: The provided information does not specify whether historical data is available, which can be essential for users conducting backtesting or historical analysis.
In conclusion, FatafatStockScreener.in offers a comprehensive set of screening criteria and intraday analysis tools that can be valuable for traders and investors, particularly those focused on the Indian stock market. However, users should be aware of the learning curve, data accuracy, and potential subscription costs associated with the platform. It is essential to thoroughly understand and test the features to make the most of this screening tool.
Conclusion
In conclusion, navigating the intricate landscape of intraday trading in India demands not only skill and expertise but also the right tools to make informed decisions. The journey through our exploration of the 8 best intraday stock screeners has illuminated the diverse array of options available to traders. From user-friendly interfaces to advanced technical analysis capabilities, these screeners offer a range of features to suit traders at every level.
By leveraging the power of these top-notch intraday stock screeners, traders can gain a competitive edge by swiftly identifying opportunities that align with their strategies. The real-time data updates, customizable filters, and charting tools provided by these screeners can streamline the decision-making process and potentially lead to more favorable trading outcomes.
Ultimately, armed with the insights from this guide, traders can confidently select the ideal intraday stock screener that resonates with their needs. Whether you’re a newcomer seeking simplicity or an experienced trader demanding precision, these screeners pave the way for more effective intraday trading experiences. Embrace the advantages offered by these tools and embark on your journey towards more successful and strategic intraday trading in the Indian stock market.
Frequently asked questions (FAQ)
What is an intraday stock screener?
An intraday stock screener is a tool or platform that allows traders and investors to filter and identify stocks for potential intraday trading opportunities. It helps users find stocks that meet specific technical or fundamental criteria for intraday trading.
Why should I use an intraday stock screener?
Using an intraday stock screener can save time and effort in identifying potential trading candidates. It allows traders to focus on stocks that match their trading strategies and criteria, increasing the likelihood of profitable trades.
What features should I look for in an intraday stock screener?
Look for features such as real-time data, customizable screening criteria, technical analysis tools (e.g., charts, indicators), historical data access, and the ability to set alerts for price or volume conditions.
Are there free intraday stock screeners available in India?
Yes, there are free intraday stock screeners available, but they may have limitations compared to premium or paid versions. Free screeners often provide basic features and delayed data.
Which stock exchanges do these screeners cover?
The coverage of stock exchanges can vary. Some screeners focus on specific exchanges like NSE (National Stock Exchange) and BSE (Bombay Stock Exchange) in India, while others may provide international market data as well.
Can I use intraday stock screeners for swing or positional trading?
Yes, many intraday stock screeners can be adapted for swing or positional trading by adjusting the screening criteria. They often provide features like moving averages and trendline analysis suitable for longer timeframes.
How do I choose the best intraday stock screener for my needs?
Consider your trading style, budget, and specific screening criteria. Look for a screener that offers the features and data coverage that align with your trading objectives.
Do I need to have advanced technical analysis skills to use these screeners?
While some technical analysis knowledge can be helpful, many intraday stock screeners offer user-friendly interfaces and predefined screening strategies, making them accessible to traders with varying skill levels.
Are there mobile apps available for intraday stock screening in India?
Yes, there are mobile apps designed specifically for intraday stock screening in India. These apps allow traders to screen and monitor stocks on the go.
Do intraday stock screeners provide back testing capabilities?
Some intraday stock screeners offer back testing features that allow users to test their trading strategies using historical data to assess their potential effectiveness.
Are there any risks associated with using intraday stock screeners?
The primary risk is relying solely on screeners without conducting thorough research and analysis. Always verify the data and use screeners as a tool to support your decision-making, not as the sole basis for trades.
Do I need a paid subscription for the best intraday stock screeners?
While many intraday stock screeners offer free versions, advanced features and real-time data may require a paid subscription. Evaluate your needs and budget before opting for a subscription.
Can I use intraday stock screeners for derivatives trading, such as futures and options (F&O)?
Yes, intraday stock screeners often provide features for analyzing options and futures, including open interest, implied volatility, and options strategies.
Is customer support available for users of these screeners?
Most reputable intraday stock screener providers offer customer support channels, including email, chat, or phone support, to assist users with any questions or issues.
Can I use intraday stock screeners for day trading and scalping?
Yes, intraday stock screeners are commonly used for day trading and scalping strategies. They help traders quickly identify short-term opportunities based on specific criteria.
What are the common technical indicators available in intraday stock screeners?
Intraday stock screeners often provide technical indicators such as moving averages, relative strength index (RSI), moving average convergence divergence (MACD), and stochastic oscillators, among others.
Can I set up alerts and notifications for specific stock conditions with these screeners?
Yes, many intraday stock screeners allow users to set up alerts and notifications for price movements, volume changes, or specific technical indicator crossovers, keeping traders informed in real-time.
Are there any tutorials or educational resources available for using intraday stock screeners effectively?
Some intraday stock screener providers offer tutorials, guides, and educational resources to help users understand how to use the platform and make the most of its features.
Can I screen stocks based on fundamental criteria, such as earnings or revenue growth?
While intraday stock screeners primarily focus on technical analysis, some platforms offer limited fundamental screening options, such as filtering stocks based on market capitalization or industry sector.
How frequently is the data updated on these intraday stock screeners?
Data update frequency can vary among screeners. Many offer real-time or near-real-time data, while others may have delayed data updates, so it’s important to choose a platform that suits your trading style.
Are there any restrictions on the number of stocks I can screen at once ?
Some intraday stock screeners may impose limitations on the number of stocks that can be screened simultaneously. Check the platform’s terms and conditions for such restrictions.
Can I use intraday stock screeners for algorithmic trading or automated trading systems?
Some intraday stock screeners offer APIs (application programming interfaces) that allow users to integrate the screener’s data and alerts into their algorithmic trading systems.
Are there community forums or user communities where I can discuss strategies and share insights related to intraday trading with these screeners?
Some intraday stock screener platforms have user communities or forums where traders can interact, share trading ideas, and discuss strategies.
How do I ensure the security of my personal and trading data when using intraday stock screeners?
It’s crucial to choose reputable and secure platforms. Look for encryption protocols, data protection measures, and privacy policies to safeguard your information when using intraday stock screeners.
Can I access intraday stock screeners from multiple devices, such as desktop, tablet, and mobile?
Many intraday stock screener platforms offer multi-device access through web-based applications and mobile apps, providing flexibility for traders who want to monitor the market from different devices.
1 thought on “8 Best Intraday Stock Screeners in India”